Mutual funds and fixed deposits are two of the most common ways Pakistanis try to grow their savings. For Instance, the Mezan Cash Fund total value is PKR, 157290010000/- which offers around 10% per year growth. But the advertised returns rarely account for front-end load, AMC fees, capital gains tax, or inflation. The value of the fund shows how many of us think that we are earning 10% per year by investing in the fund, but here’s what your real return looks like once those are factored in, and a free calculator to check it for yourself
If you’ve spent any time around Pakistani investment forums, WhatsApp groups, or bank branches, you’ve heard the pitch. A relationship manager pulls up a brochure and points to a number: “This fund gave 42% last year.” A mutual fund’s TV ad flashes “Top performer, 2023.” A fixed deposit officer quotes you an annual profit rate that sounds better than anything your salary account is doing.
And on paper, it looks great. Until you actually run the numbers.
The problem isn’t that these returns are fabricated — most of the time they’re technically accurate. The problem is what they leave out and never tell you. And once you add those missing pieces back in the calculation, a lot of “great” investments quietly turn into mediocre ones, or worse, into investments that lose you money in real terms instead of gains.
Mutual Fund Return You’re Shown Is Never the Return You Get
Start with the headline number itself. When a mutual fund advertises a 25% or 70% return, that’s usually the best single year pulled from its history — not the average, and definitely not what you’d have earned if you’d stayed invested for five or ten years. Funds rarely lead with the year they lost 15%, or the three years they barely beat inflation. You’re being shown the ceiling, not the average.
Then there’s what gets taken off the top before you ever see a return:
- Front-end load — a percentage cut from every rupee you invest, before it even starts earning anything
- Management/AMC fees — charged year after year, whether the fund makes money or not
- Capital gains tax — in Pakistan, 15% for tax filers and 30% for non-filers, taken from your actual gains
- Inflation — the silent one nobody mentions, which eats into your “real” purchasing power every single year
None of these show up in the glossy brochure number. All of them show up in your account balance.
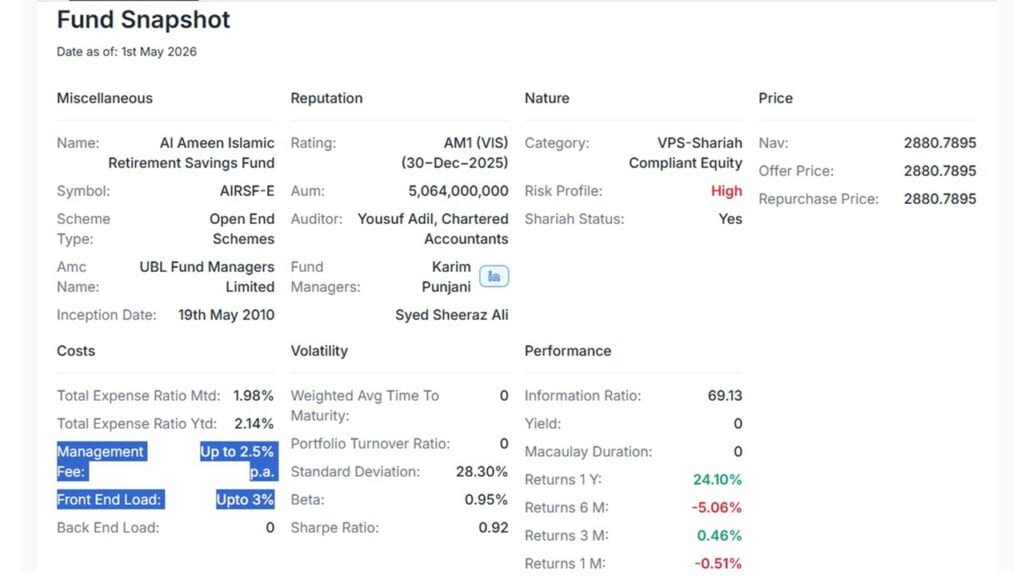
(image is a screenshot taken from Sarmaaya.pk website)
Fixed Deposits Have the Same Problem, Just Quieter
Fixed deposits feel safer because the rate is guaranteed and printed on paper. But guaranteed doesn’t mean good. A 12% FD sounds solid — until you subtract tax on the profit, and then subtract inflation running anywhere from 8% to 25%+ in recent Pakistani history. What’s left is often a real return close to zero, or negative. You didn’t lose money on paper. But you have surely lost purchasing power, which is the only kind of loss that actually matters when you go to spend your money.
Why Most SIP Calculators Don’t Help You Here
This is usually where a smart investor tries to do the math themselves, opens a SIP or mutual fund calculator, plugs in a return rate and a time horizon, and gets a big, satisfying number at the end.
The trouble is that almost every calculator like this is built the same simplified way: initial amount, monthly contribution, expected return, done. No fees. No tax. No inflation. It’s not lying to you exactly — it’s just answering a much simpler question, a 1+1 =2, not the one you should actually care about, which is: what will I actually be able to buy with this money when I need it?
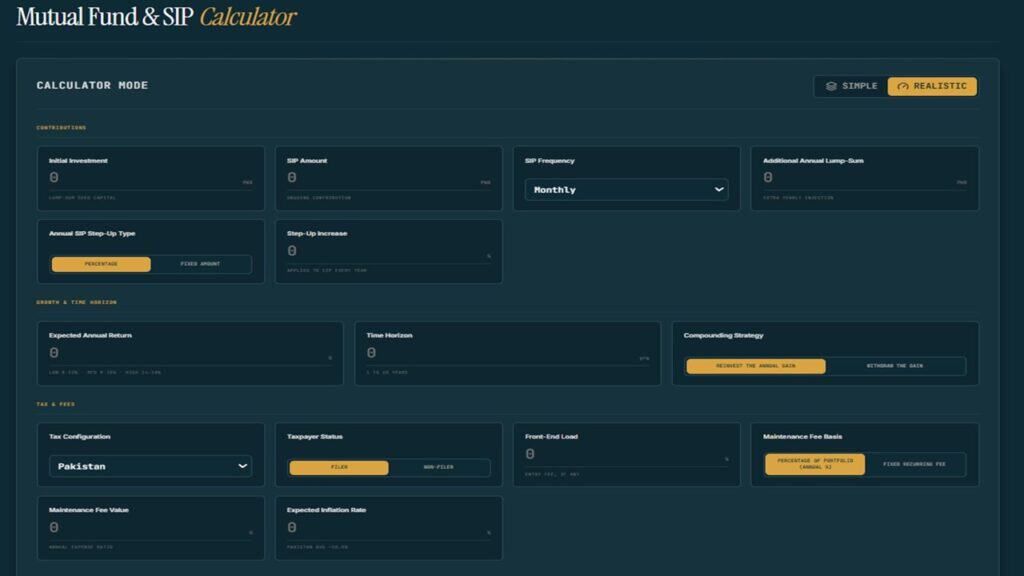
So, how can we calculate all these “hidden” value eaters of our investment? Since we can not count them with a simple SIP calculator available online, we found a calculator designed specifically to handle all these “charges”. You can easily calculate it with this Mutual Fund & SIP Calculator. investorstoolkit.pk/mutual-fund-calculator
What Makes This Calculator Different
This calculator has two modes. Simple mode works like every other calculator out there — quick, clean, no complications — useful if you just want a rough idea. But switch to Realistic mode, and it accounts for everything the industry conveniently leaves out:
- Front-end load on every contribution, including step-up SIPs
- AMC/maintenance fees, either as a fixed charge or a percentage of your portfolio
- Capital gains tax, with built-in Pakistan filer/non-filer rates (or your own custom rate for any other market)
- Annual step-up contributions, so your projection matches how people actually increase their SIP over time
- Inflation adjustment, so the final number reflects real purchasing power, not just a bigger digit
[Screenshot: cost breakdown section — front-end load, AMC fees, capital gains tax]
Instead of one optimistic total, you get a full breakdown here: total invested, gross gain, tax and fees paid, gain after tax and fees, and — the number that matters most — your gain after inflation. For a lot of “safe” investments, that last number is smaller than people expect. Sometimes it’s negative.
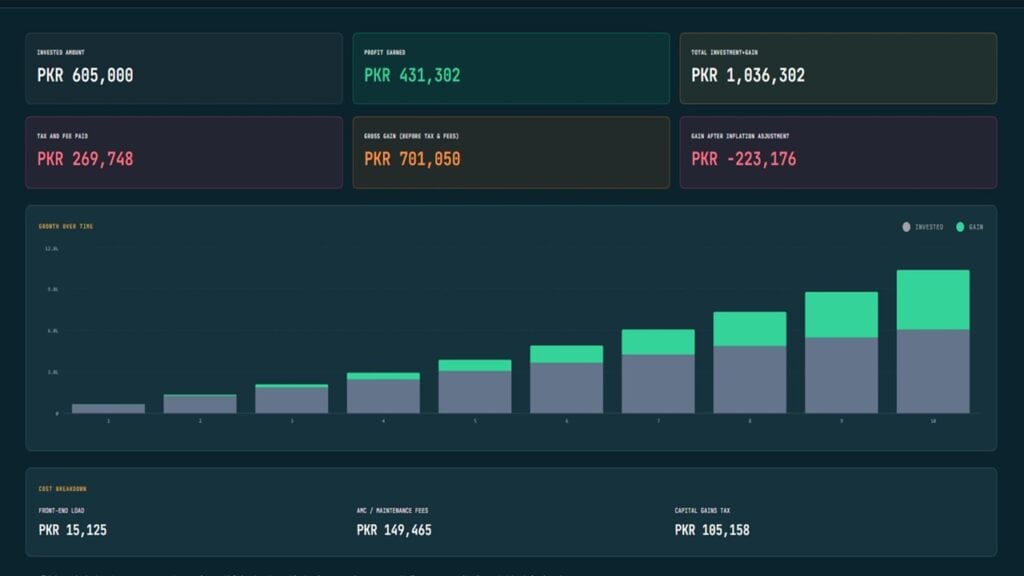
You can also toggle between reinvesting your annual gains or withdrawing them, and see exactly how that choice compounds — or doesn’t — over your chosen time horizon.
Run the Numbers Before You Trust the Brochure
None of this is a claim that mutual funds or fixed deposits are useless. It’s a claim that you should never decide anything based on a single advertised percentage without first accounting for what it costs you to earn it and what it’s worth once inflation has taken its share. The gap between the “advertised” return and the “realistic” one is often the difference between an investment being genuinely worthwhile and one that just feels good on a brochure.
Before you commit money to any fund or deposit, put the actual numbers — the real fee structure, your tax status, and a realistic inflation estimate — into a calculator that doesn’t hide them from you. You might still decide to invest. But you’ll be deciding with the full picture, not the marketing version of it.
One Last Thing
Even with the most realistic projection in hand, timing matters as much as the math. Money you might need in the next year or two — an emergency fund, upcoming expenses, cash you’re not sure what to do with yet — shouldn’t be locked into a fund or a fixed deposit chasing an extra percentage point. Only invest money that’s genuinely idle: cash sitting in a current account or at home, doing nothing for you either way, but losing its value over time. That’s the money that can afford to ride out a bad year. Everything else deserves to stay liquid.
You can try the full calculator, including the Realistic mode breakdown, here: SIP Calculator.